If your business decisions are not backed up by solid data, it’s high time to reconsider your approaches. Data is your best advisor when it comes to what works and what doesn’t in business. And it’s not something aspiring e-commerce business owners can ignore. Amazon gives you a perfect opportunity to get data insights on every aspect of your business. It tracks every single move of your customers and knows everything about how buyers interact with your account. From general sales trends to very detailed info on customer behavior, Amazon reports are invaluable to any business.
But!
Just because Amazon tracks everything doesn’t mean you should do the same.
If you dive into the ocean of all the data that your Amazon Seller Central account provides, you can get overwhelmed with a lot of unsorted information, which (even if useful) is not the everyday necessity for making the best decisions.
So, what should you do?
Correct! You should learn the art of filtering out the most important information.
How?
Most e-commerce owners delegate the daunting task of figuring out Amazon Seller Central reports to specialized Amazon data analytics software like SellerMobile. It simplifies the process significantly.
- Seamlessly integrates with your Seller Central account.
- Automatically extracts all the data in real-time with no manual input from you.
- Simplifies and analyzes all the rough data from Seller Central, transforming it into easy-to-read graphs and tables.
- And the best part. SellerMobile gives personalized suggestions to each business owner based on the analysis of the data. So, even if you don’t know exactly what each number means, you know what should be done.

Read below our detailed guide on how to utilize your Amazon reports with maximum efficiency and minimum worry about data processing.
What Are Amazon Seller Central Reports?
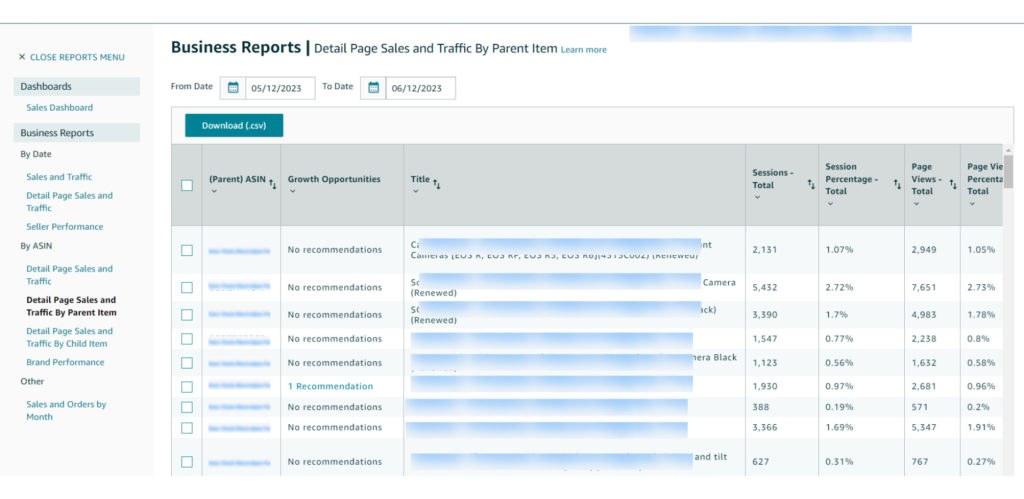
Amazon reports look like this,
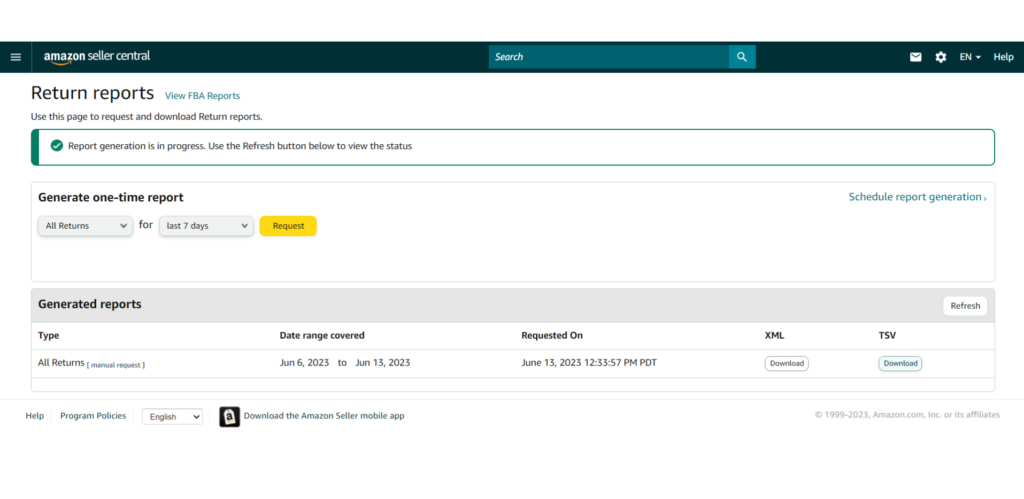
this,
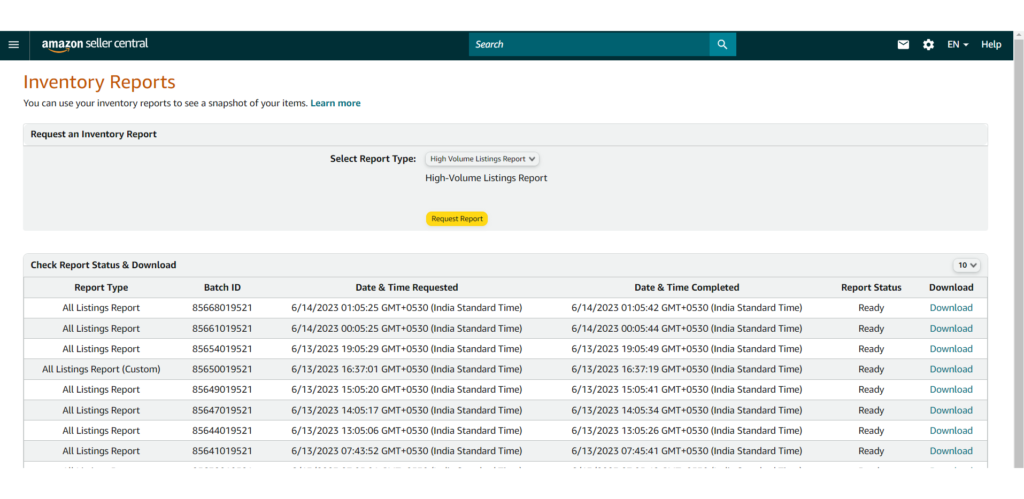
or maybe this.
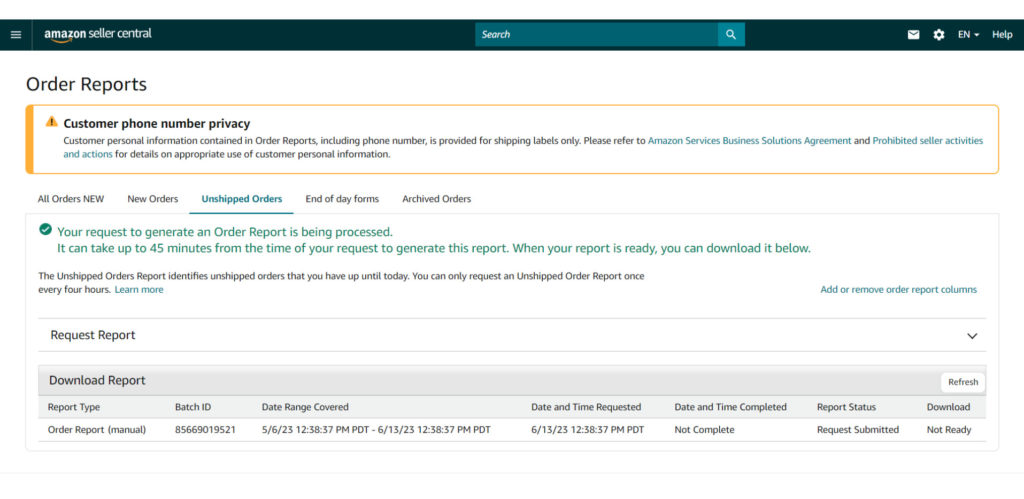
Amazon Seller Central reports are automatically generated documents that contain all kinds of data about your business performance. It includes information about sales, traffic sources, inventory management, customer service requests, and much more.
The Amazon reports are generated by the platform itself. You don’t need to do any manual work here, nor are you able to edit the data.
Every action you or your customers take on Amazon is registered in the Seller Central reports with as much detail as Amazon is currently able to extract with its tracking tools.
Why Are Amazon Reports Important?
In such a dynamic environment as Amazon, relying on blind strategies is akin to setting sail without a map, hoping for favorable winds. Reports, on the other hand, are your compass and map combined.
They provide you with a panoramic view of your business’s past, present and even glimpses into the future. They help you analyze data, detect patterns, and make informed decisions that gut feelings alone can’t help with.
In more simple words, Amazon reports approve or reject your assumptions on which strategies can help you grow your business. You’re more informed and, therefore, more likely to make the right decision at the right time.
Where Are Reports in Amazon Seller Central?
Amazon’s treasure trove is not hidden deep underground. To access all the valuable information, log into your Amazon Seller Central account, navigate to the main tab, and choose the “Reports” section.

Please, note, different sellers can see different Amazon reports here based on their selling plans or specific traits of their business. For example, Amazon FBA sellers can see different reports than brand-registered sellers.
If you have your Seller Central account linked to SellerMobile for more advanced analysis and user-friendly reports, the data will appear in our Analytics tab.
In this case, you don’t need to log in to your Seller Central account anymore. All the data from there is automatically synced with SellerMobile without any manual input. You will just need to select the type of report that you are interested in and review all the extracted info + your personalized business suggestions.

10+ Amazon Reports Worth Focusing On
OK, finally, here we have a list of some essential Amazon reports you should keep an eye on. If you track these, you can be confident you know what’s happening in your Amazon business.
Amazon Business Reports
1. Sales Dashboard Reports
Where do we start? Sales, of course. Everything you do, you do for a single purpose – to make sales and see the desired +1 order or +$X in revenue. And that’s what sales dashboard reports help you track.
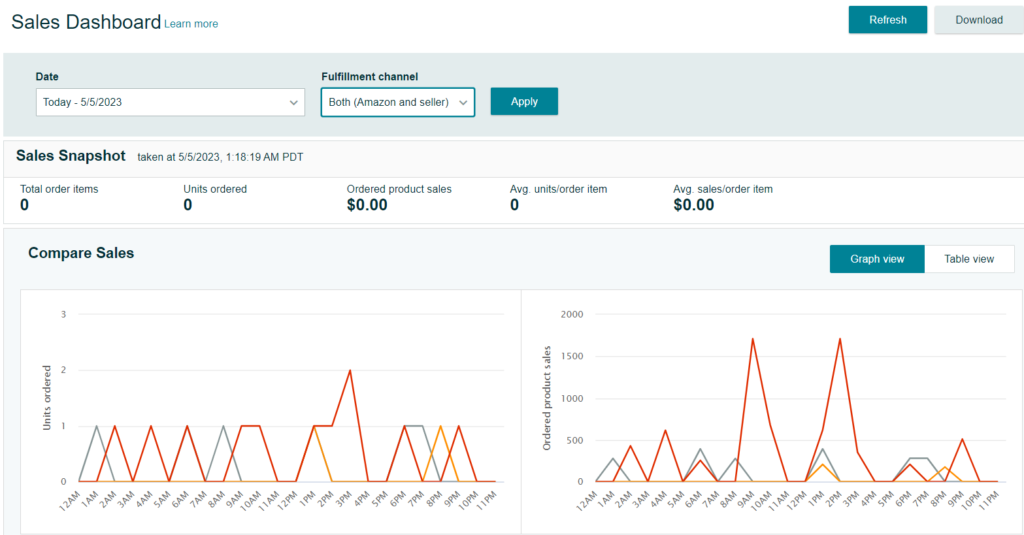
This report gives you a quick overview of your total sales on Amazon. You can see your sales performance over time by viewing the data by today’s date, week-to-date, month-to-date, year-to-date, or any custom date range you select (maybe your marketing team wants to track the performance before and after their last promotions).
The sales dashboard reports have trend graphs for you easily compare data over time. That’s the best source to understand your historical sales, average order value by customers and units sold.
What Does SellerMobile Add to Seller Central Sales Reports?
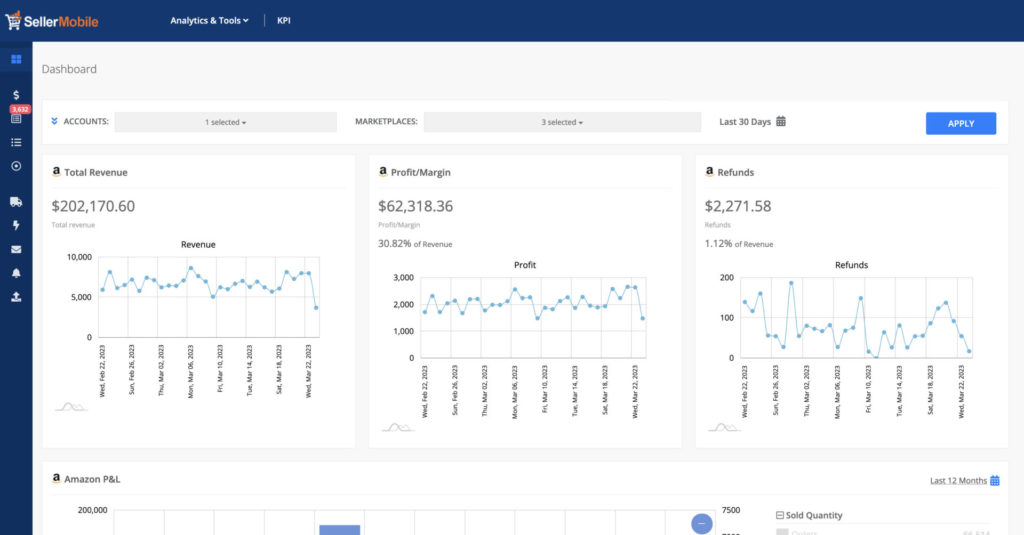
SellerMobile also allows you to see fees and costs associated with your sold items so you have better insight into your profits.

2. Sales and Traffic Reports
Once you move from the “By ASIN,” reports of Amazon business reports to the “By Date” group of reports, you can see more detailed information on your sales and traffic.
It’s worth mentioning “By Date” reports are more useful if you want to have product-level details.
Here you can see the following information.
- Sales and Traffic: You can check total product sales and the total number of units sold for a certain date or time period.
- Detail Page Sales and Traffic: Similar to the above report, it includes more details related to product-driven metrics like conversion rate, Buy Box percentage, and other sales-related info.
- Seller Performance: Last but not least, you can check your A-Z claims, negative feedback, order refund rates, and other metrics that indicate how well you work with customers.
As you can see, sales and traffic reports are comprehensive, giving you an overview of how your business performs in terms of sales and customer service.
3. Detail Page Sales and Traffic by ASIN
Now delving into the intricacies, you can track ASIN granularity, scheduling of automatic report delivery, and generally more comprehensive business insights for your Amazon business with this report.
Previously, all the sales-related data was available in Amazon’s “Reports” section for manual download. Now, a powerful Amazon Selling Partner API update took the sales reporting to a whole new level. It provides users with an automated, code-free data pipeline for all the data related to sales and traffic.
Which details this API derives? It shows insightful metrics such as ordered product sales, units ordered, claim amount, page views, page traffic, and more.
To generalize what you can track, here are the key data detail page sales and traffic report shows.
- Detail Page Sales and Traffic By SKU
- Detail Page Sales and Traffic By Parent Item
- Detail Page Sales and Traffic By Child Item
Key Metrics to Consider in Amazon Reports
OK, you can access sales dashboard reports now, and though they provide a consolidated view of the most important metrics of your sales performance, there is still a place to filter the data even further.
Without further ado, here are the key metrics that you should consider when tracking your sales performance.
Units Ordered
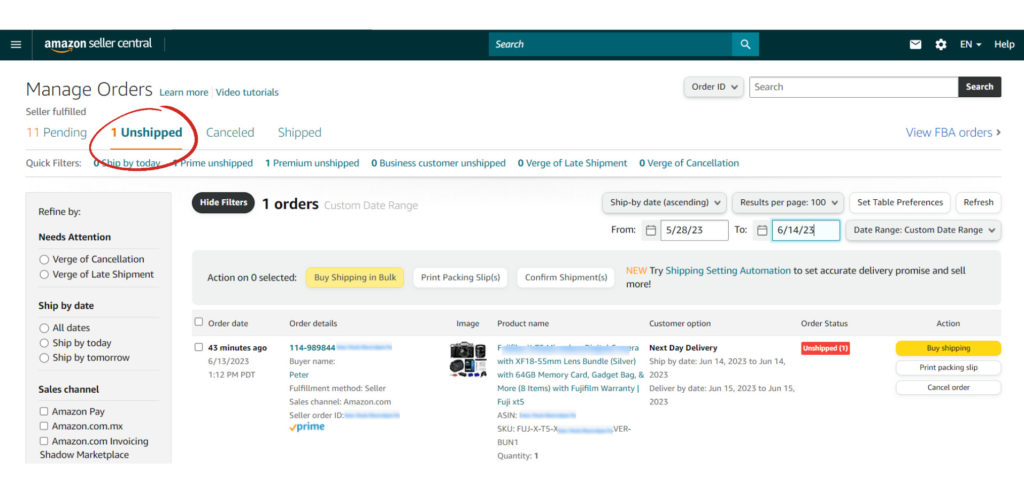
Pretty straightforward metric, which actually speaks much about how certain products in your listings are performing.
Units ordered show the number of products customers order from you. It’s useful because you can see your highest-grossing items here and those that need your attention and improvement.
With this metric, you can understand which items need more boost during your next promotion campaigns. So you can distribute your resources more efficiently.
Total Sales

When it comes to understanding your sales performance, there are two crucial metrics to track.
- Ordered Product Sales: This is the price of one item multiplied by the total number of units ordered. This metric shows the product’s cost in its naked version, without shipping costs and other fees.
- Gross Product Sales: Now, we add shipping costs, all the add-ons like gift wrap costs, etc., to ordered product sales to see not only the net price of the item’s orders but also how much customers finally paid to get the product.
You may ask, why bother with these metrics?
The answer is you need both gross and net sales to understand how much you finally earn from your total sales.
Page Views and Sessions
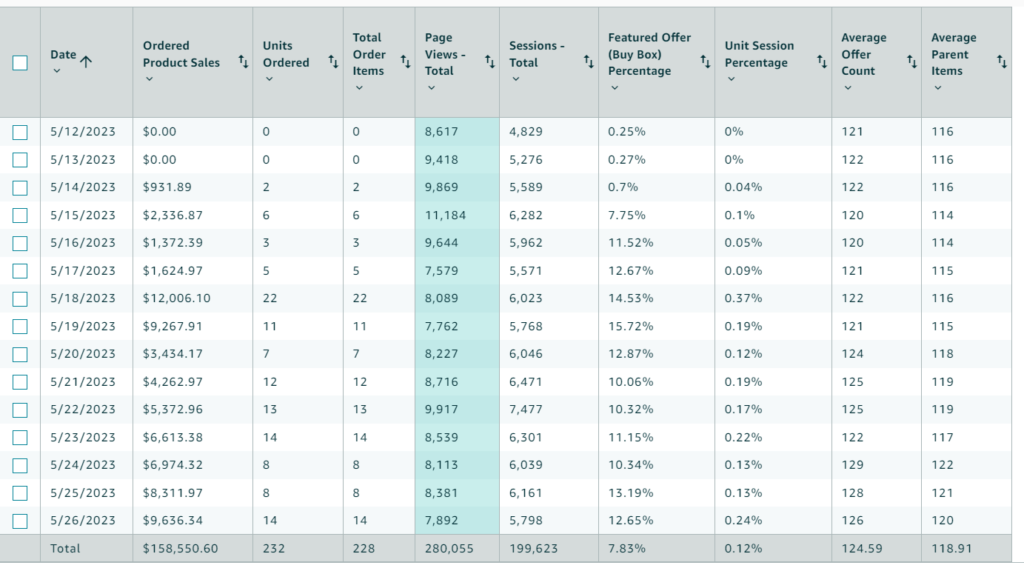
Imagine you watch after your buyers when they enter your Amazon store. Would it be great to see what they do there, which listings they check, where they get hooked by your product images and captions, or where they get bored and decide to leave?
If you’d love to have that kind of visibility, you should track page views and sessions. Let’s briefly define them.
- A session is one visit of the customer to your Amazon account, which stops counting as a session after some period of inactivity. More simply, it’s how often customers enter your store, spend their time doing different things, and then leave it. Each visit of a customer to your account, no matter how many different places they click on, is counted as one session.
- Page views is the number of unique visits per Amazon listing. If your customer checked 7 items from your listings during one session, you will see 7 unique views in your Amazon reports.
Good. Now, how the rough numbers of sessions and page views can help you?
First, your sessions should be less than page views. If they are nearly equal, you should conclude that most buyers come to your account and leave it almost immediately after viewing one item without consulting more listings. What should be done? Improve attractiveness of listings, have better images, more captivating captions, and anything else that can encourage customers to browse more items.
Second, you can check the tendency of your sessions. If you’re getting fewer and fewer views, it may be the right time to invest heavily in boosting your rankings and visibility on Amazon.
The same issue can be with page views. If you notice a sharp difference in page views for some of your items, there might be a visibility problem.
Conversion Rate
Order session percentage or conversion rate is the percentage of users that visited your listings and bought something. It’s calculated by dividing the number of customers that made a purchase by total sessions, multiplied by 100%.
For example, if you had 100 sessions and 10 of them made a purchase, your conversion rate is 10%.
The standard good for Amazon’s conversion rate is considered to be 10-15%, but it, of course, depends on the niche and other factors. You should always keep an eye on your conversion rate because if you notice a drop in it, investigate what’s wrong with that listing or listings, as customers may not find them attractive enough to stay and buy something.
Amazon Seller Central Advertising Reports
Common wisdom suggests everyone invests in Amazon ads at this or that level. That’s because Amazon’s competition is fierce and is all about visibility. To make that happen, you should know what kind of ads to create and how much money to invest in each ad group. That’s why Amazon provides so many metrics to track your ad campaigns.
4. Search Terms
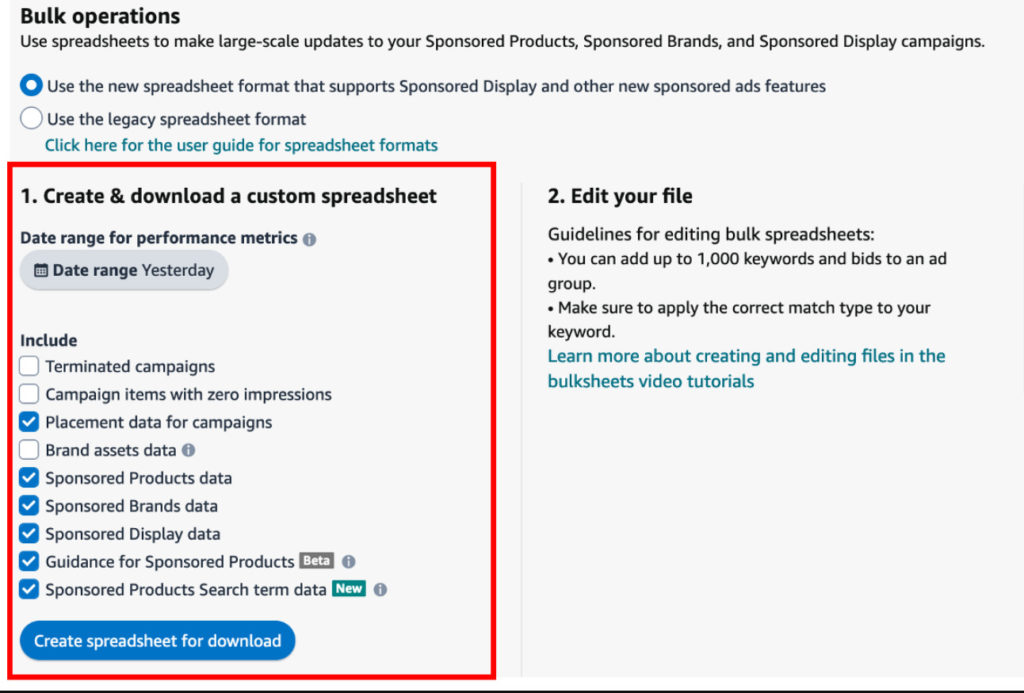
Let’s say you sell portable phone chargers. Will you be surprised to know your audience does not know this term and they search for your items the way they are used to call that product – power bank, for example?
Search terms will help you determine customers’ queries when searching for your items. Not only that, but you can also get an excessive data about the search terms, like keyword’s match type, search term used, sales and conversion rate, click-through rate, etc.
Why do you need this? To know which keywords are better to use in your ads to better relate to your target audience.
What Does SellerMobile Add to Amazon Seller Central Advertising Reports?
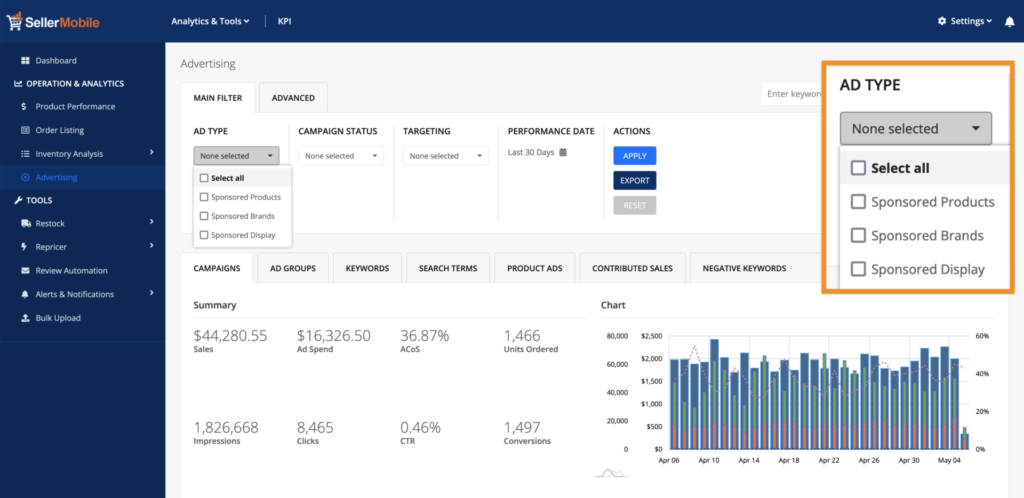
SellerMobile has a comprehensive dashboard for advertising reports, where you can filter your data by campaigns, filter negative keywords, and track very detailed metrics like CTR, ACoS, Sales, Ad Spend and other relevant data.

5. Targeting Reports
It’s time to go broader with keyword analysis. Targeting reports don’t just show specific search terms, but they help you track overall keywords, ASINs, and other categories.
Most e-commerce owners use this report for two reasons.
- Detecting and replacing duplicate keywords: If you see the same keyword appearing several times, it’s time to remove or replace them with more relevant ones.
- Tracking two crucial ad metrics, RoAS and ACoS: Return on Ad Spend and Advertising Cost of Sales, are the two most important metrics for any ad campaign, which are shown in this report.
6. Purchased Product Reports
Here, you can see performance data for those products that were purchased by customers but not due to advertising as a part of the campaign. It includes targeting expressions and keyword IDs associated with specific sales that let you understand what keywords and targeting expressions are most effective for driving sales.
7. Advertised Product Reports
Now, coming to the opposite of purchased product reports, advertised product reports show the performance of those items that were promoted during your campaign.
That’s a great chance to figure out what products perform better and which need more investment to get a higher ROI. It’s also good to see which keywords perform best in attracting customers so you can optimize your campaigns further.
8. Ads Placement Reports
Want to see when your ads were shown with the breakdown of placements? The ads placement report is the one you need. It shows when the ad was seen and allows you to refine each campaign by ratings, price range, and shipping.
Ads placement Amazon business reports have been greatly updated recently, becoming a more comprehensive and useful tool for sellers.
Other Amazon Seller Reports
Well, turning to the last page of Amazon business reports overview, we have some other reports that can come in handy, even if they are not so often used in daily routine.
9. Fulfillment Reports
Though we list this Amazon report at the end, fulfillment reports are one of the most extensive ones in Seller Central. There are six main categories of data you can track with this report.
1. Inventory: This will reveal how much stock is left and what SKUs are running low.
2. Fulfillment: Here, you can filter orders by date range, SKU, order status, and more.
3. Returns: This report will show all items which have been returned by customers along with the reason for return.
4. Customer Concessions: If you do some special discounts or refunds, you should track it in the customer concessions report.
5. Removals: You may happen to request some of your items back from Amazon’s inventory for different reasons. This will be tracked in the removals category.
6. Amazon Global Logistics: If you use the option for booking and managing logistics with Seller Central, Amazon global logistics report will display all details and status updates of your shipments.
10. Return Reports
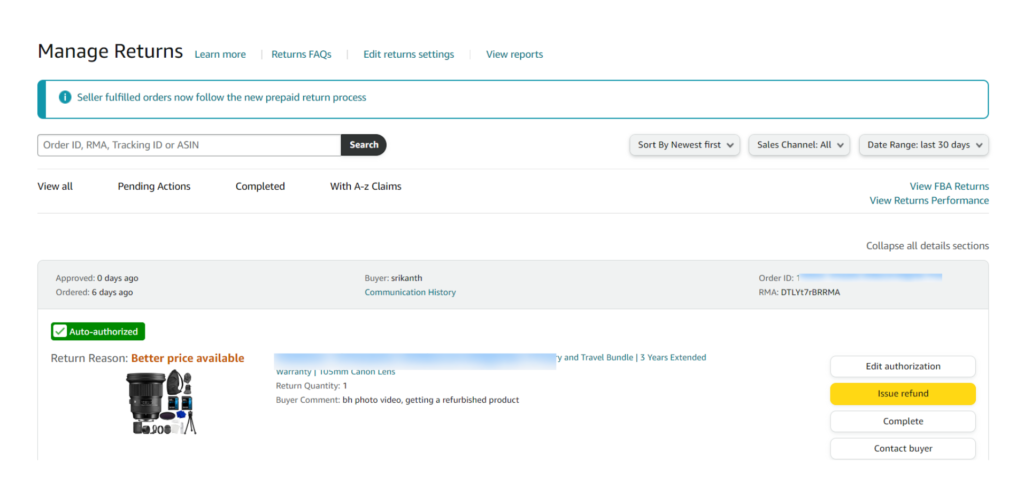
It’s sad, but returns happen. And when they happen, you need careful tracking to keep them under control and realize what went wrong that shouldn’t be repeated.
But there is good news. It’s not always you who’s guilty if something happened with the order. Return reports will show you which orders have been returned and why. By tracking the columns of disposition, customer return reason, and status, you can get to the details of what happened and take appropriate measures.
For example, you can see that certain returned item is marked as sellable by Amazon. This means that even though the item was returned, it can still be sold because it’s in good condition and no damage was done.
11. Amazon Sales Tax Reports
Probably not the best user-friendly report, Amazon sales tax reports have many columns due to the complex nature of the tax laws. You don’t need to check every single row, though. Just ensure you remit the appropriate tax on time, as it’s your cornerstone responsibility as a seller.
Recently, Amazon signed contracts with certain states and started collecting taxes on behalf of the sellers, so maybe you don’t need to deal with it at all.
If you still need to do things manually, Amazon will display your sales breakdown by transaction type and the tax collected on those transactions. This will allow you to fill out the appropriate tax forms.
12. Custom Reports
Huh. So many Amazon reports, and still can’t find what you need?
Amazon assumed something like this may happen and created an option of creating custom reports to meet your specific needs.
You can create three types of reports that show only the metrics you are interested in.
Real-time
Historical
Login/Logout Amazon reports
Once your custom report is created, save it to return to it later again or share it with your colleagues for being on the same page.
Got Lost in Data Overload? Here’s a Simple Way Out!
Not everyone loves scrolling through endless columns of data, even if the data is analyzed and organized. If you’re one of those people, know you’re not alone, and there’s a way to make it easier.
As talked previously in this article, there is a specialized Amazon analytics software, SellerMobile, that takes the whole burden of analyzing data off your shoulders.
Used by 30,000+ Amazon sellers, this software is a friendly source with reports that use the exact data from Amazon Seller Central but are presented in a much more understandable format.
Here’s a broad overview of what SellerMobile can do for you.
Want a more detailed view of SellerMobile’s Amazon reports?
Let’s review some examples.
Inventory Forecast by SellerMobile
We know every Amazon seller dreams about having a magic crystal ball to see into the future and understand which items and how much to restock so that sales are maximized.
But who can understand these Amazon buyers with unpredictable needs? Sometimes you overstock and sometimes lose sales because the demanded item runs out of stock.
OK. No longer a problem with SellerMobile. Its inventory forecast report analyzes your historical sales and determines the right time to order more.
Not just sales performance of the past, SellerMobile also accounts for seasonality and sales trends to bring you the most exact prediction.
And the cherry on top is that the software also considers lead times for each supplier. So, when it hints you to order more of a certain product, it also calculates when your supplier will send the items if you order them at a specific date.

Automated Review Requests to Boost Amazon Rankings
Receiving 5-star reviews is the wow moment for every Amazon seller. Good reviews boost your rankings on Amazon and drive more sales, they give more trust to new customers reviewing your account, and they make sure your brand is reputable.
So good, but many buyers, even very satisfied ones, simply forget to leave a review. Luckily, SellerMobile has your back with the automated review request system.
Look above. This simple dashboard asks you when you want your buyers to receive the automated review request. You can do the same thing manually in Seller Central, but it’s time-consuming and error-prone if you do it for hundreds of orders.
With SellerMobile, once the settings are decided, you can relax and let the software do the rest. You decide when your buyers will most probably be ready to leave a review, and the software handles the rest.
Detailed Product Performance
Aside from the big picture, you most probably want to have a close look at how individual products are performing. That’s one of the most valuable pieces of information for any Amazon seller, as slow-moving items can sometimes take your capital and make it stagnant.
SellerMobile ensures you don’t miss that with its detailed product performance report. The dashboard presents product performance in user-friendly tables so that you can easily spot items that are doing good and bad, compare their performance to the past, and make better decisions in the future.
In SellerMobile, you can see a detailed breakdown of information for each product, including the profit and margin you generate per item, inventory age and availability of the product, the number of reviews it has, its best and worst selling day, and more.

The Final Thoughts
Data is the new currency of the 21st century. But having lots of data doesn’t make you a winner. Analyzing it and knowing what to do with it is more important than ever.
There are two places you can get help. One is Amazon itself, with a huge pool of data updated every second in Seller Central dashboards.
Another one is specialized Amazon data analytics software – SellerMobile, which works with Seller Central’s data to refine it and make it far easier to understand and use in your decisions.
SellerMobile and Seller Central can work together to give you better insights about your Amazon store so that you can increase revenue and drive more sales. Integrate your SellerMobile account with your Seller Central store, and you’re ready!
