Learn to derive meaningful insights from Amazon analytics data and you’ll have a winning sales strategy. Amazon seller analytics is a condensed library of dos and don’ts, giving you the ability to measure and monitor your sales performance.
With Amazon analytics, several key metrics can be tracked:
- product performance
- customer behaviour
- inventory levels, etc.
Whether you’re a seasoned seller or just starting out, knowing how to work with seller analytics is the best way to boost your business.

What Is Amazon Sales Data Analysis?
Amazon sales data analysis is the process of analysing sales data obtained from Amazon, which can provide insights into customer behaviour, product trends, and overall market trends. The data can be used by sellers and businesses to make informed decisions about their future strategies on Amazon.
Here are the key metrics that Amazon reveals for its users.

Sales Trends
This metric allows you to see short-term and long-term sales trends on Amazon, including seasonal variations.
Customer Behaviour
Analysis of sales data can also provide valuable insight into customer behaviour, such as purchase frequency, average order value, and product preferences.
Return on Investment (ROI)
By analysing sales data, businesses can evaluate their ROI to identify the results of their previous strategies and assess products’ profitability.

In addition to the customer behaviour insights mentioned, Amazon sales data analysis can also help businesses identify which sales channels are driving the most revenue, such as Amazon Advertising or Amazon Sponsored Products.
Where Is Amazon Sales Data Stored?
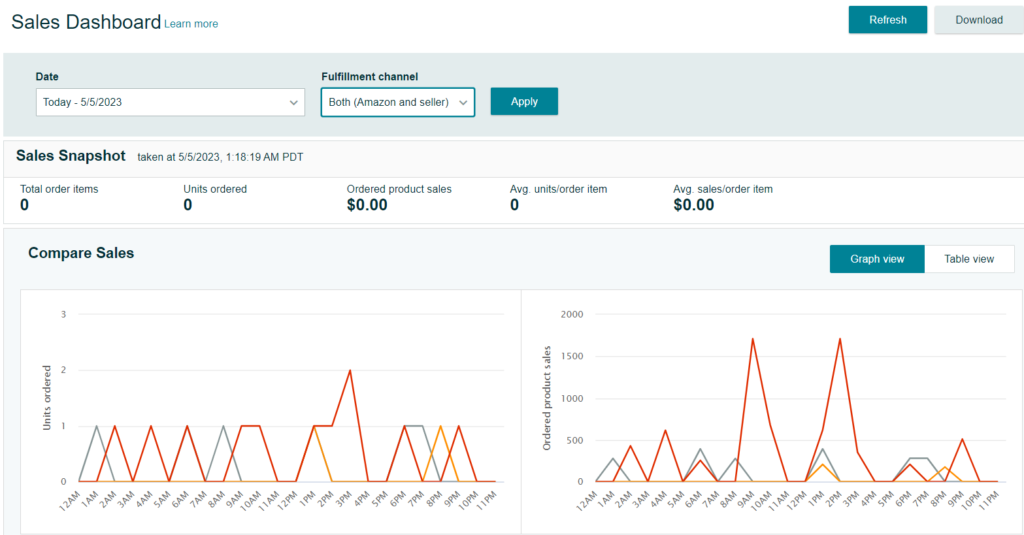
Amazon sales data is stored in the Seller Central platform, which is the hub for Amazon sellers to get data about their sales, inventory, and product listings. Seller Central collects all the data connected to the seller’s Amazon account and automatically generates user-friendly reports.
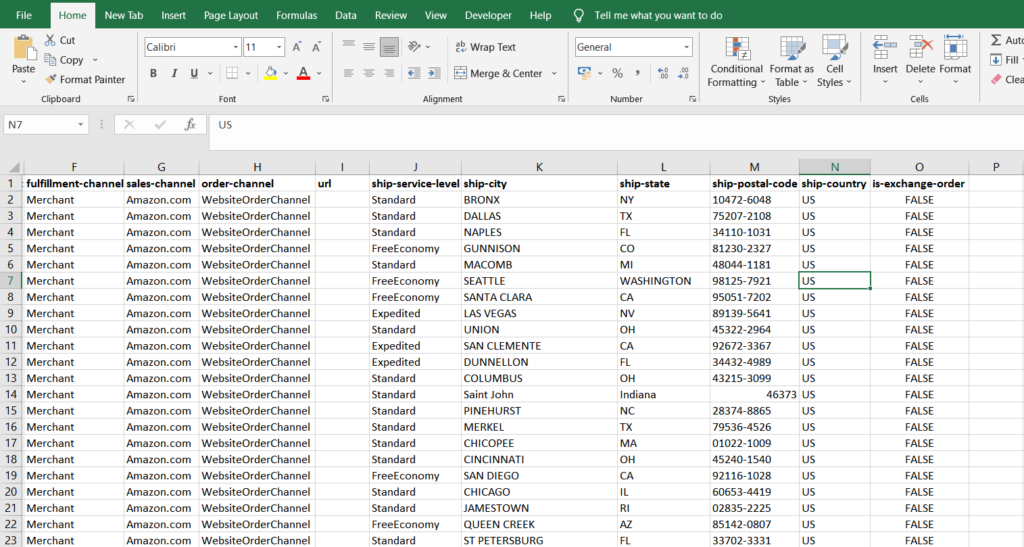
One key aspect of Amazon sales data stored in Seller Central is order data. This includes information such as order ID, product SKU, quantity, price, shipping details, and customer details. This data can be used by sellers to track their sales volume, revenue, and profit margins.

Another metric is inventory data. This includes information on current inventory levels, restocking dates, and sales velocity. By analysing this data, sellers can ensure that they have enough stock to meet demand and avoid stockouts.
Amazon also provides sellers with access to advertising data through Seller Central. This includes data on impressions, clicks, conversions, and advertising spend. Sellers can use this data to optimise their advertising campaigns and increase their return on investment.
Additionally, Seller Central provides access to customer data, such as customer feedback and reviews. This data can be used to improve customer satisfaction level and product rankings on Amazon.
Which Key Sales Metrics Should Amazon Sellers Track?
In Amazon Seller Central, there are key metrics available for sellers to improve their performance.
- Sales Revenue
- Units Sold
- Conversion Rate
- Order Defect Rate (ODR)
- Customer Feedback and Ratings
- Advertising Cost of Sales (ACoS)
Sellers can use these metrics to understand their sales performance and identify areas for improvement of their Amazon business.
Total Sales
Total sales refer to the amount of revenue generated by a business over a specific period, and it is a critical indicator of business performance. It can be used to evaluate the success of a business and its ability to generate revenue.

For Amazon sellers, tracking total sales is important because it helps them understand their overall business traffic on the platform. It allows them to analyse their sales trends and identify any potential issues that may be affecting their sales performance. Moreover, tracking total sales can help sellers set realistic revenue targets and monitor their progress towards achieving those targets.
Various strategies can be used by sellers to increase total sales on Amazon, such as optimising their product listings, offering competitive prices, using advertising and promotion campaigns, improving customer service, and building brand awareness.
Average Selling Price
The average selling price (ASP) is calculated by dividing the total revenue generated from sales by the total number of units sold.
A high ASP indicates that a seller’s products are selling at a premium price point, which can be beneficial for their profit margins. However, a low ASP shows that the seller’s products are being sold at a discounted price, which may affect their profitability.
Sellers should aim to optimise their ASP by identifying the right price point for their products based on factors such as competition, product quality, and customer demand.
Tracking ASP can also provide valuable insights into a seller’s overall sales performance and product mix. By analysing ASP alongside other metrics such as conversion rates and customer reviews, sellers can optimise their product portfolio and pricing strategy to drive higher revenue.
Best Seller Ranking
Best Seller Ranking (BSR) is a metric used by Amazon to rank products based on their popularity and sales performance in a specific category. A lower BSR indicates higher sales performance and popularity, with the top-selling products in each category achieving the lowest BSRs.
The BSR algorithm takes into account various factors, including historical sales data, sales velocity, and customer reviews, among others. It is updated hourly and reflects the relative sales performance of a product within its category.

Sellers can use BSR to monitor their products’ performance on Amazon and to gauge how their sales compare to their competitors. Tracking BSR over time can also help sellers identify trends in consumer behaviour and adapt their product and pricing strategies accordingly.
It is important to note that BSR is a relative metric, meaning that it only reflects a product’s performance within its category. Therefore, a low BSR in one category may not necessarily translate to high overall sales on Amazon.
Sellers can improve their BSR by optimising their product listings, pricing, and marketing strategies to increase sales velocity and positive customer reviews. This includes leveraging Amazon’s advertising tools, optimising product titles and descriptions with relevant keywords, and ensuring timely and accurate fulfilment and customer service.
Profit and ROI
Profit and return on investment (ROI) are two essential metrics that Amazon sellers should track to measure their business’s financial performance.
Profit refers to the amount of money left over after deducting all costs, including product costs, shipping fees, Amazon fees, advertising costs, and any other expenses incurred in running the business.
Profit margins can vary widely depending on the product, category, and competition, so it’s crucial for sellers to monitor their profit margins closely and adjust their pricing and expenses accordingly.

ROI, on the other hand, measures the return on investment for a product or campaign. It is calculated by dividing the net profit by the total cost of goods sold or advertising spend. A high ROI indicates that a seller is generating significant returns on their investment, while a low ROI may indicate the need to adjust their pricing or marketing strategy.
Sellers can improve their profit and ROI by optimising their pricing strategy, reducing costs wherever possible, and utilising Amazon’s advertising tools to drive sales and improve visibility.
How to Analyse Amazon Sales Data Without Advanced Skills?
If you want to analyse your Amazon sales data but lack advanced skills, an Amazon seller analytics software can help.
By syncing with your Seller Central account, this software can automatically analyse your sales data and provide you with insights and suggestions based on your business’s previous performance. So, you no longer need to be a business or sales analyst to analyse your Amazon data.
SellerMobile: Advanced Amazon Seller Analytics for Your Amazon Business
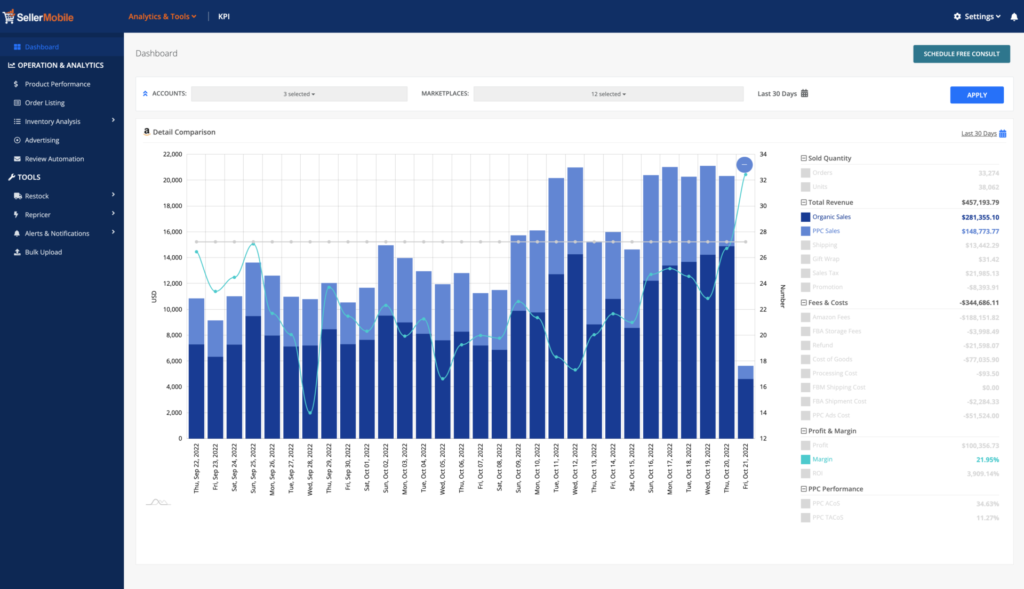
SellerMobile is an advanced Amazon seller analytics software designed to help Amazon sellers grow their business by providing them with valuable insights and actionable data without technical or analytical skills. With its user-friendly interface and automated analysis, SellerMobile offers a wide range of features that can help you enhance your sales and stay ahead of the competition.

One of the key features of SellerMobile is its real-time sales tracking, which allows you to monitor your sales performance and identify trends and patterns as they happen. You can track your sales across multiple Amazon marketplaces, and view detailed analytics on product sales, revenue, and profits.
SellerMobile also offers inventory management tools that allow you to monitor your inventory levels and avoid stock-outs, as well as identify excess inventory that may be weighing down your profits.
Conclusion
Sellers can become part of Amazon’s seller analytics platform by signing up for an Amazon Seller Central account. Once registered, you can access a range of Amazon seller analytics tools and reports, including the Amazon Retail Analytics (ARA) dashboard and the Amazon Advertising platform.
Amazon seller analytics is a treasure hub for anyone who does not want to work with blind strategies. By exploring and analysing the accumulative data collected by Amazon Seller Central, all your business insights can be at your fingertips with several clicks.
If you don’t want to go into the tedious task of figuring out a massive amount of raw data from Seller Central, SellerMobile can help!
It will seamlessly integrate with your Seller Central account, automatically extract any data whenever any change occurs in your inventory and provide you with improvement suggestions based on real-time data tracking.
As a result, you always know what’s happening in your Amazon account even without logging in.


