Success in e-commerce is usually all about the numbers. So, in this article, we’ll introduce you to the top 16 Amazon KPIs that you should start tracking this month.
From sales metrics to customer feedback, these KPIs provide insight into different aspects of your business and can help you identify areas for improvement.
But tracking KPIs can be a daunting task, especially when you have to manually gather and analyze data from multiple sources. That’s where SellerMobile comes in. Our platform automates the process of tracking and analyzing your Amazon KPIs, making it easy for you to stay on top of your business performance.
So let’s dive in and discover the top 20 Amazon KPIs you need to track, and how SellerMobile can help you do it.
What KPIs Does Amazon Use and Why Bother About Them?
Amazon KPIs are crucial metrics that help sellers measure the health and performance of their e-commerce business. By tracking these metrics, sellers can make informed decisions to improve sales, profit margins, and customer satisfaction.
Important Amazon KPIs include:
- sales revenue,
- profit margin,
- conversion rate,
- customer lifetime value,
- and return on investment.
Tracking these KPIs helps sellers identify issues in their business and take corrective action before they become major problems. For example, monitoring conversion rate can help sellers understand how well their product listings are performing and adjust their pricing or marketing strategies accordingly.

Amazon KPIs are essential for the success of an e-commerce business. By keeping an eye on these metrics, sellers can better understand their business and make accurate decisions about their marketing, inventory, and overall strategy. Without tracking KPIs, sellers risk missing out on crucial insights and data that can help them improve their business and stay ahead of the competition.

The Amazon KPI Trio Promising to Boost Your Sales
With so many metrics to track, it can be overwhelming for Amazon sellers to know where to focus their attention. That’s why prioritizing the most critical KPIs is essential for success. Here are the top three Amazon KPIs that can help boost your sales: Sales, Profit, and Inventory.
Sales
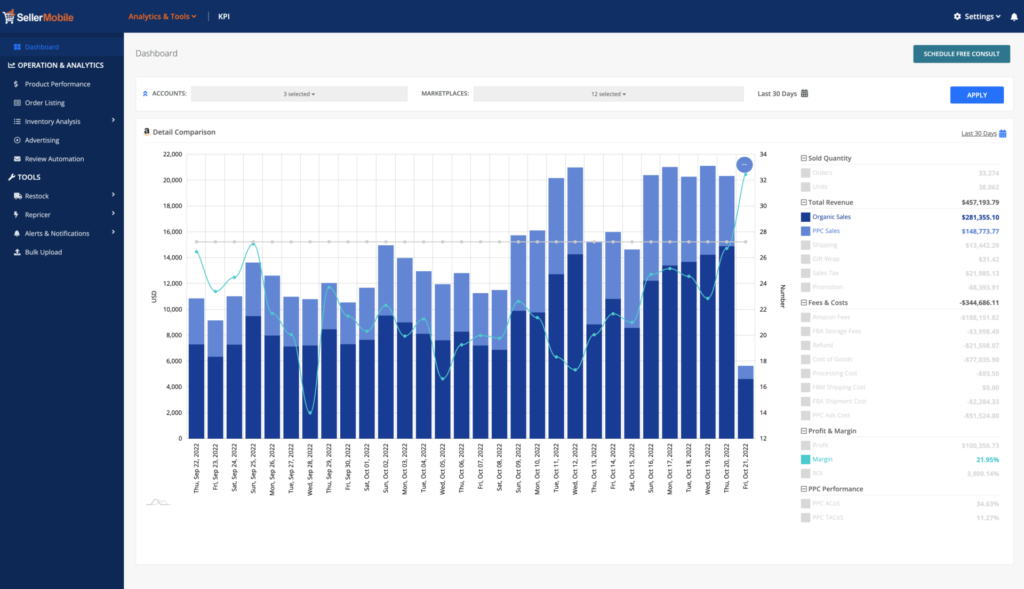
Sales Revenue is a crucial KPI for Amazon sellers, representing the amount of money generated from sales. By tracking sales revenue, sellers can understand their financial performance, identify trends, and adjust strategies accordingly. Tools like Amazon Seller Central and third-party software like Shopkeeper can help sellers track their sales revenue and optimize their performance.
Profit
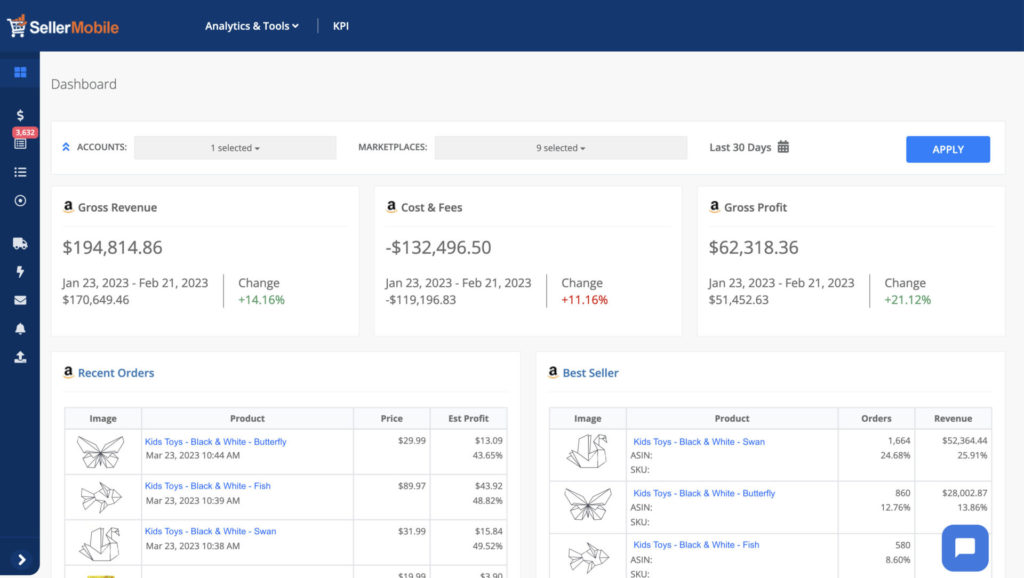
Profit is the ultimate goal for any business, and Amazon sellers are no exception. This KPI helps you understand how much profit you’re making after deducting all your expenses. Tracking your profit can help you identify areas where you can cut costs and maximize your revenue. By monitoring your profit margin, you can ensure that you’re making a healthy profit and adjust your pricing and advertising strategies to maximize profitability.
Inventory
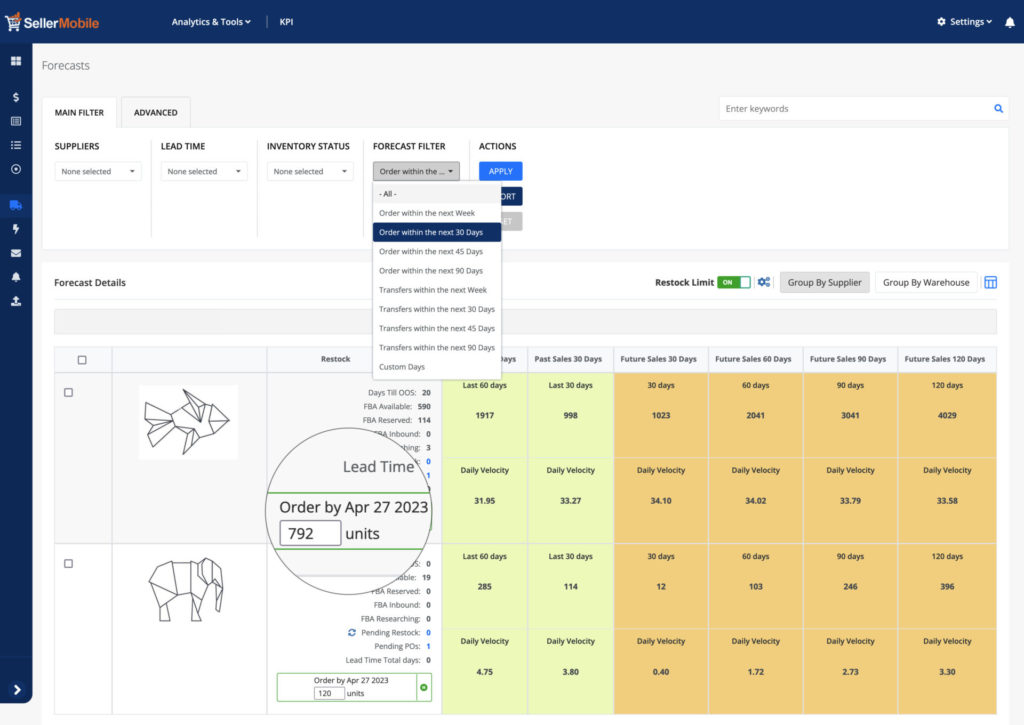
Inventory tracking is crucial to ensuring that you have the right products in stock when customers are ready to buy. This KPI helps you monitor your stock levels and avoid stockouts or overstocking. By tracking your inventory turnover rate, you can identify slow-moving products and adjust your inventory levels accordingly. This can help you free up cash flow, reduce storage costs, and improve your overall sales performance.
Top 16 Amazon KPIs You Must Track

1. Sales Revenue
Sales Revenue is a crucial KPI for Amazon sellers, representing the amount of money generated from sales. By tracking sales revenue, sellers can understand their financial performance, identify trends, and adjust strategies accordingly. Tools like Amazon Seller Central and third-party software like Shopkeeper can help sellers track their sales revenue and optimize their performance.
2. Return on Ad Spend
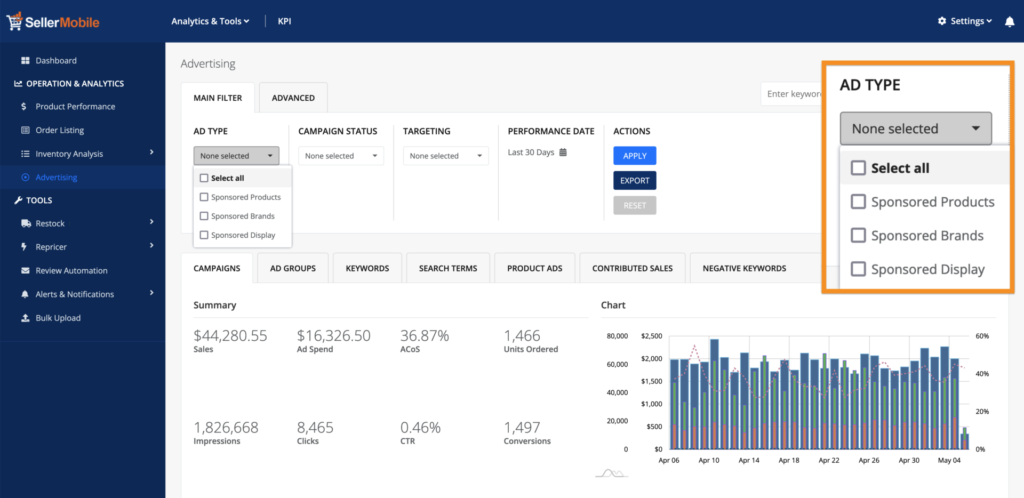
ROAS is a KPI that measures revenue generated per advertising dollar spent. A high ROAS means profitable campaigns, while a low ROAS signals areas for adjustment. By tracking ROAS, sellers ensure campaigns generate positive ROI, adjusting strategies to optimize advertising spending.
3. Click-Through Rate
Click-Through Rate is a percentage that measures the number of clicks an ad generates relative to the number of impressions it receives. It’s a crucial metric for assessing the effectiveness of ad campaigns and understanding user engagement. A higher CTR indicates that the ad resonates well with the audience, while a lower CTR may indicate that the ad needs to be optimized. To calculate CTR, divide the number of clicks by the number of impressions and multiply the result by 100.
4. Order Defect Rate

Order Defect Rate is a metric that measures the percentage of orders with negative feedback, A-to-z Guarantee claims, or chargebacks. A high ODR can lead to account suspension, while a low ODR indicates good service and quality products. To calculate ODR, divide the number of orders with issues by the total number of orders and multiply by 100 to get the percentage.

5. Percentage Buy Box
The Percentage Buy Box is the frequency of a seller’s product appearing in the Buy Box on Amazon, which drives sales and visibility. High percentages indicate competitive prices, quality products, and reliable shipping, while low percentages signal the need for pricing, shipping, or service improvements. To improve this metric, sellers must offer competitive pricing, fast shipping, and excellent customer service.
6. Late Shipment Rate
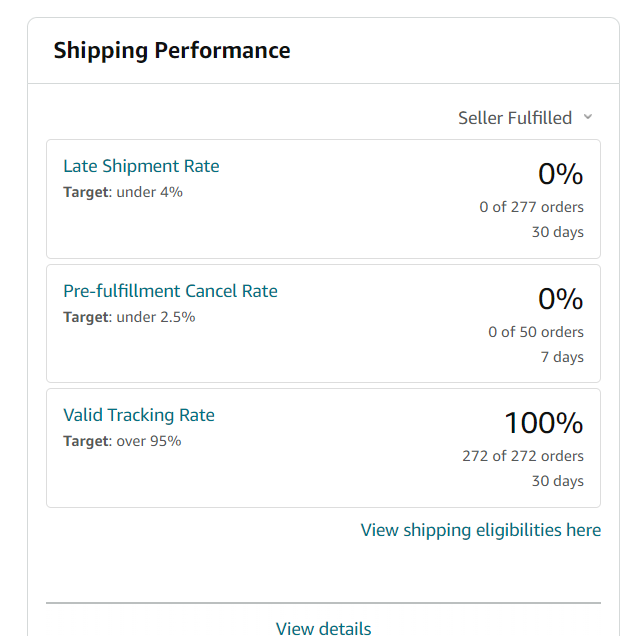
Late Shipment Rate is the percentage of orders that were not shipped within the expected time frame. This KPI can directly impact account health and the ability to win the Buy Box. It’s crucial to keep Late Shipment Rate below 4%, as anything higher can lead to account suspension. Amazon provides a Late Shipment Rate report in Seller Central to track this metric. Improve by maintaining inventory levels, using FBA for fast shipping, and monitoring orders regularly to avoid delays.
7. Contact Response Time
Contact Response Time measures the average time a seller takes to respond to a customer’s message. Amazon mandates a Contact Response Time of less than 24 hours, but quicker response times can lead to higher customer satisfaction and seller ratings. The metric can be tracked in the Performance tab of the Seller Central account. Automating responses, promptly addressing customer inquiries, and enabling notifications for new messages can help improve Contact Response Time.

8. ACoS
Advertising Cost of Sales measures the effectiveness of your advertising campaigns by calculating the ratio of ad spend to sales generated by the ad. A low ACoS indicates efficient use of ad spend, while a high ACoS may require adjustments to targeting or ad copy. Amazon advertising account tracks this KPI. To improve ACoS, target high-converting keywords, optimize product listings, and test various ad creatives. Through optimized ACoS sellers can boost sales and increase the return on investment for advertising campaigns.
9. RoAS
Return on Ad Spend is the revenue generated by ads divided by the cost of those ads. This KPI determines the profitability of advertising efforts. A high RoAS means ads are generating a good return on investment, while a low RoAS indicates that adjustments in targeting or ad copy may be necessary. RoAS is trackable in Amazon advertising accounts. Improving RoAS involves targeting high-converting keywords, optimizing product listings, and testing different ad creatives.
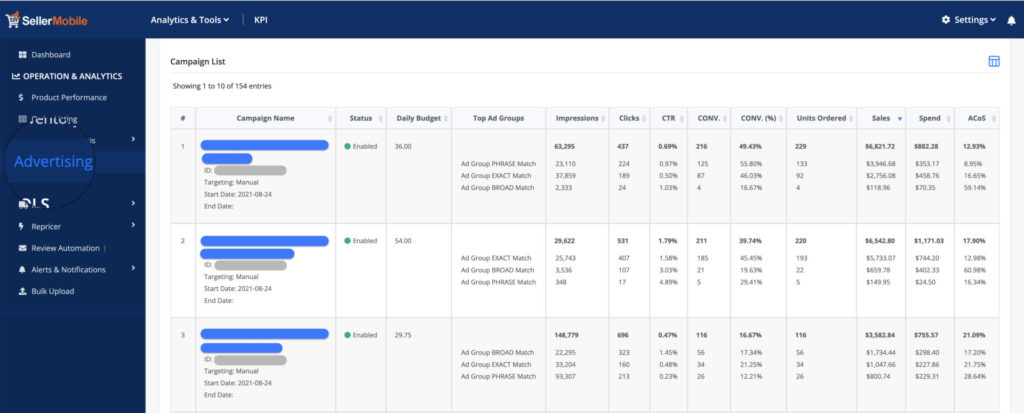
10. TACoS
Total Advertising Cost of Sales is the ratio of ad spend to sales, providing an overview of advertising effectiveness. Low TACoS suggests good ROI, while high TACoS may require targeting or ad copy changes. TACoS can be tracked in Amazon advertising accounts. To improve, target high-converting keywords, optimize product listings, and test ad creatives. Optimizing TACoS can increase sales and boost return on investment for advertising campaigns.
11. Cost of Sales
Cost of Sales (COS) is a KPI that measures the direct cost of producing or acquiring the goods sold. By dividing the total cost of goods sold by total revenue generated, Amazon sellers can track COS and identify inefficiencies in their supply chain. This can include high shipping costs or overpriced raw materials. Lowering COS can improve profit margins and competitiveness.

12. Average Order Value
Average Order Value (AOV) is the average amount a customer spends per order, a critical KPI to increase revenue and profit. To calculate AOV, divide the total revenue by the total number of orders. A low AOV may indicate that customers aren’t purchasing additional items or that prices are too low. Increasing AOV can be achieved through strategies such as cross-selling, up-selling, and offering personalized product recommendations.
13. Conversion Rate
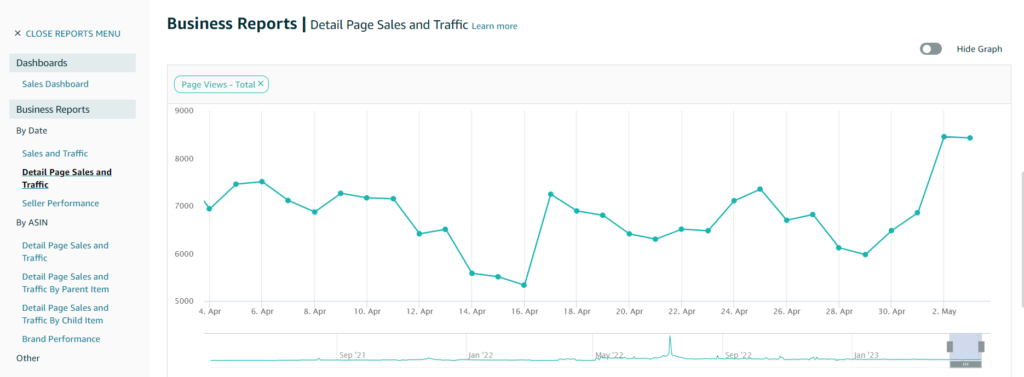
Conversion rate is the percentage of website visitors who make a purchase. On Amazon, it’s the percentage of visitors who buy a product after clicking on the listing. A high conversion rate indicates an optimized product listing that appeals to buyers. This metric helps in optimizing images, updating descriptions, and adjusting prices.
14. Inventory Performance Index
The Inventory Performance Index (IPI) measures a seller’s inventory health and efficiency, based on factors like excess inventory and sell-through rate. A high IPI score means a healthy inventory and efficient management, leading to faster delivery times, higher customer satisfaction, and increased sales. A low IPI score results in storage fees, delayed shipping, and lost sales opportunities. Through IPI sellers can optimize inventory and improve business performance.
15. Cancellation Rate
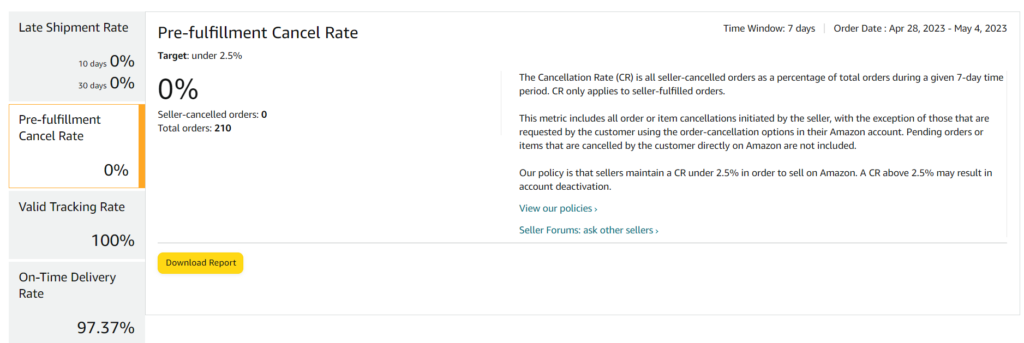
Cancellation rate is the percentage of orders that are canceled by either the seller or the buyer. High cancellation rates can be a red flag to Amazon, as it can negatively impact customer experience and lead to lost sales. Sellers can lower their cancellation rates by ensuring that they accurately describe their products, providing excellent customer service, and promptly addressing any issues that arise. Cancellation rate helps sellers identify any patterns or issues that may be contributing to cancellations.
16. Product Ranking
Product ranking on Amazon determines a product’s visibility in search results. The higher the ranking, the more likely it is to be seen by potential customers, leading to increased sales. Sellers can optimize ranking by tracking and analyzing keyword relevance, customer reviews, and sales velocity. By monitoring regularly, sellers can improve their listings and gain a competitive advantage. This metric is especially important for new products or sellers looking to establish their presence on the platform.

How to Track KPIs on Amazon With SellerMobile
SellerMobile is a powerful analytics tool that simplifies the process of tracking Amazon metrics for sellers. By connecting the tool with your Amazon Seller Central account, SellerMobile automatically gathers all raw data and transforms it into actionable insights and good reports.
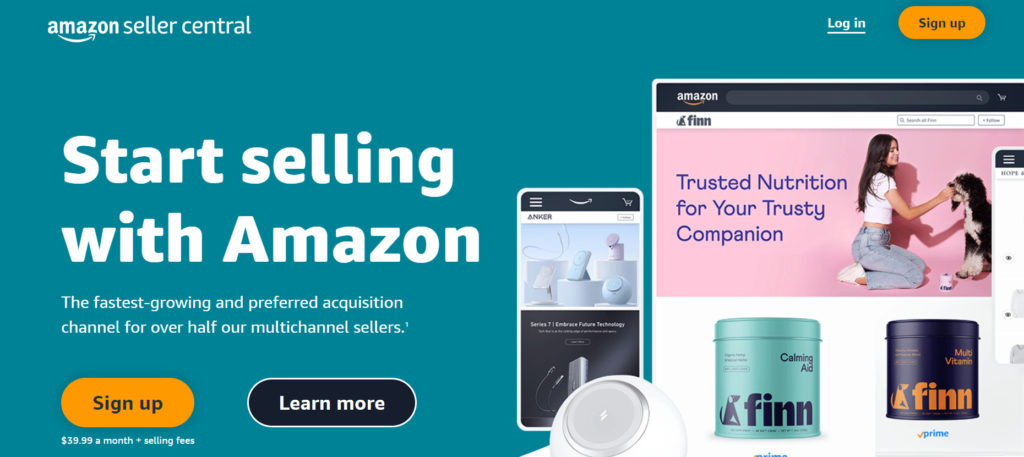
SellerMobile offers a range of features to track key performance indicators (KPIs), including sales analytics, inventory analytics, and product performance. This saves sellers time and effort in calculating metrics manually and provides a comprehensive view of their Amazon business performance.
One of the key features of SellerMobile is its product performance analytics. This feature enables sellers to track their product ranking, sales velocity, and keyword performance, among other metrics. It also provides insights into customer behavior, such as the most common search terms and customer review trends.
Another valuable feature is the inventory analytics tool, which helps sellers optimize their inventory levels and avoid stock outs or overstocking. The tool provides real-time insights into inventory levels, sales trends, and profit margins, making it easier for sellers to make data-driven decisions on inventory management
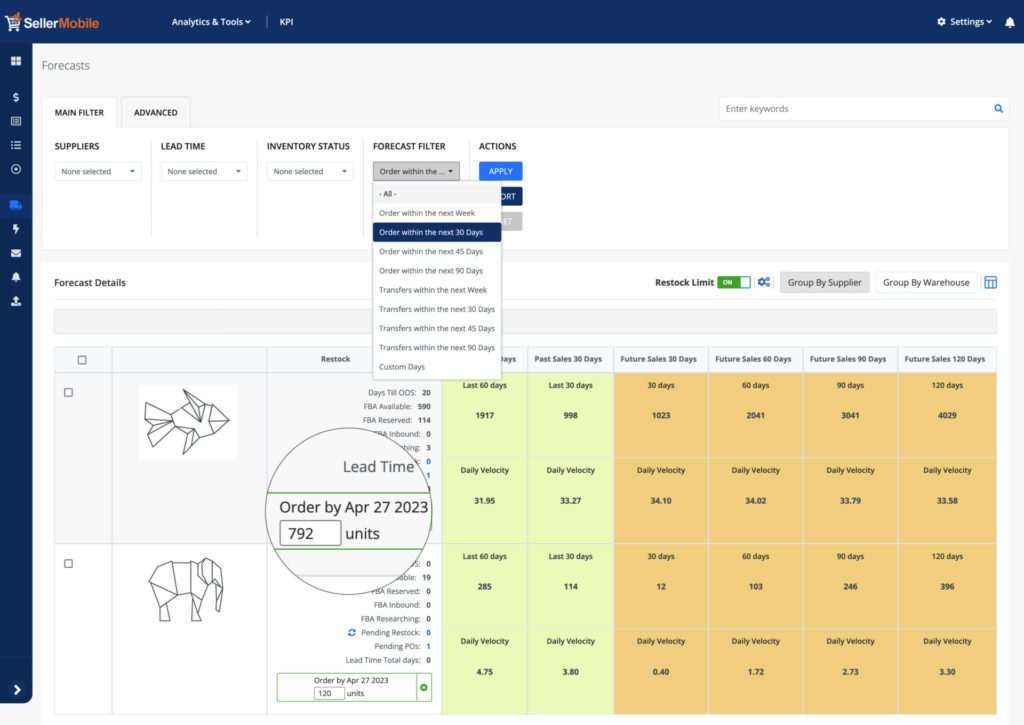
In addition to these features, SellerMobile also offers advertising analytics to track advertising campaigns’ performance and financial analytics to provide a comprehensive overview of financial performance, such as profit margins and revenue trends.
One of the significant value propositions of SellerMobile is its user-friendly interface, which makes it easy for sellers to access critical metrics and insights. It also provides personalized alerts and recommendations based on data analysis, enabling sellers to make informed decisions quickly.
Conclusion
In conclusion, tracking Amazon KPIs is crucial for the success of an e-commerce business. SellerMobile offers a comprehensive solution for Amazon sellers to track their metrics easily and optimize their performance. With its user-friendly interface, powerful analytics, and valuable features, SellerMobile can help sellers save time, make better decisions, and boost their sales.
Check out SellerMobile today to take your Amazon business to the next level!

